On Wednesday, December 19th, Linden Lab offered a look back at 2018 and something of a look ahead to 2019. There’s actually been a lot going on, although it is surprising to note that some of the bigger deliveries / anticipated deliveries actually first started to surface in 2017, when I reviewed / previewed them.
I’ll be taking a look through the major changes to Second Life myself in an upcoming blog post, so won’t delve too deeply into things here.
Unsurprisingly, Animesh is featured front-and-centre for the year’s delivery – although it’ll be early 2019 before we really start to see the impact this project has on the grid as a whole; many creators have yet to really embrace it, although there were certainly a lot of creative ideas put forward at the Content Creation User Group meetings.
The Lab’s post also focuses on the changes made to land pricing in SL – arguably the biggest set of changes in 2018. It’s fair to say that overall, the response to changes both Mainland and Private regions has been positive. In fact, it could be one – and I emphasise one, because there are others – of the reasons people might be spending less: with limited disposal income, people may have diverted some of their Second life spending away from buying things and into premium memberships and / or land.
For me, the big projects through 2018 and 2019 have been, and remain, the Environmental Enhancement Project (EEP) and the attempt to move Second Life to the cloud. The latter is hard to judge, as it is very much a behind-the-scenes move that has yet to really have an impact on the user-facing side of the platform. however, I fully expect we’ll be hearing more about it in 2019.
EEP, on the other hand, is something I think will help revolutionise the look of Second Life – even if not quite to the extent some may hope. As such, I’m actually more excited about this than Animesh (and have had great fun playing with EEP whilst it has been in beta testing).
In particular, it will finally bring environment control down to the parcel level, as well as allowing different environment settings at different altitudes. These two capabilities have, until EEP, been dependent on purely viewer-side support and limited to the use of the likes of Firestorm. With these capabilities now moving server-side, everyone gets to benefit from them, regardless of the viewer they’re using, and region / parcel holders finally get the opportunity to have users see their regions and locations as they desire (allow for people retaining the ability to override, viewer-side), and without having to request they change their viewer settings manually, or having to worry about whether or not the windlight they are using is generally available.
Again, EEP won’t be appearing fully until 2019, but the Lab’s blog post includes a nice little preview video by Silas Merlin that I’m taking the liberty of reproducing here.
For me, the most interesting part of the Lab’s blog post comes at the end, starting with a chart showing average concurrency over the last two years. It shows levels to be relatively stable.
Of course, there might be a temptation to offer contrasts between this chart and others that report more in the way of averages over shorter periods – such as those found on the Firestorm log-in screen or via infographics such as those shown on Tateru Nino’s stats pages (which appear to be recording again after having problems earlier in the year). However, given there is no actual benchmark for the Lab’s chart, such comparisons would be somewhat off-base; the chart isn’t designed to show averages or daily high-lows. It simply shows a 730-day period in which the peak daily log-ins (I would assume) have remained pretty constant, despite all the claims of falling numbers.
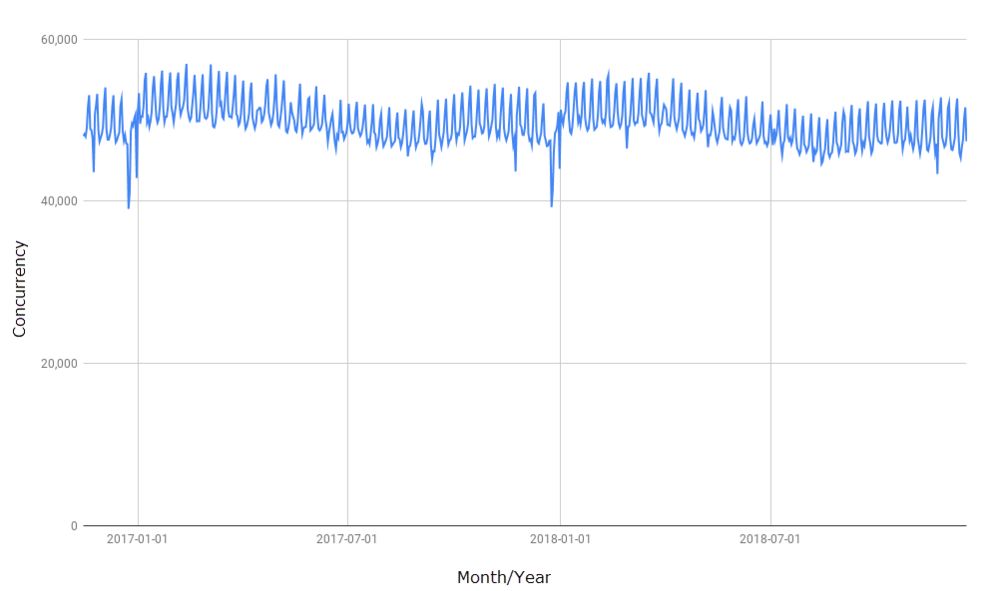
The flipside of this of course, is that equally, it’s hard to really judge such a broad trend like as this, simply because it is likely taken from one data point, be it peak daily log-ins or something else. For example: if it is tracking just peak log-ins, what were the daily minimums? How long per day were the peak periods? have there been any changes in this over the two years?
A more interesting stat is that for the amount of USD cashed-out. Put at $65 million, this is only $2 million less than that quoted for 2017, and still above the US $60 million for 2016. As such, it stands at odds with claims that the Second Life economy has been in some kind of slump during at least the second half of 2018, suggesting that things have been relatively stable overall. Which is not to say that some merchants haven’t seen a downturn in sales; but these could be the result of people shifting their spending habits more that not spending their money – see my comment re land, above.
The final two listings on the Marketplace and the Destination Guide make for interesting reading, but little more – although the fact that men’s apparel comes in 10th on the Marketplace while women’s comes in second might be an interesting topic to plumb. Is it simply because there are fewer creators focusing on menswear, or is it a combination of fewer creators and male Second Life users perhaps being less driven by the demands of fashion?
As noted, I’ll have more on the technical and other updates to Second Life in an upcoming article, and for now will leave you to read the Lab’s summation in peace 🙂 .